Any successful Instagram marketing strategy includes analysis and tracking of your activities on this social media. The reason is simple: success is the result of certain actions. And good Instagram analytics tools show you which activities work well for your page and which do not. What makes IG tools good? Find out in the article!
Analytics in any social network is an important tool that helps to understand better the target audience of a brand or blogger, track performance indicators, and create a plan for future activity. You can save time managing your Instagram by scheduling posts and Stories ahead of time and using a comprehensive range of social media analytics tools to track your progress.
The IG tools for analytics will give you valuable insights into what improvements should be made to boost your metrics. And, of course, you will need to know what to track and how! Don’t worry if you don’t know it yet! This post covers the list of the 15 most useful Instagram analytics tools (free and paid) together with important metrics you should track to get the maximum of your Instagram page.
Let’s start with checking what IG tools for analytics are the best in the market in 2023:
Free and Paid Instagram analytics Tools
1. Instagram Insights Free IG Tools
Pricing: free.
From a “good” or “good enough” perspective, many businesses would do well to use each network’s provided analytics. Facebook, Twitter, LinkedIn, and Instagram all offer businesses access to basic analytics that can help you monitor engagement, audience growth, and reach. As we’ve said, using the analytics on the Instagram platform itself is already a great place to start. If you’re using an Instagram Business or Creator account, you have access to this built-in Instagram analytics app.
But, it’s worth mentioning that you can’t view your analytics on a desktop or even download them, making it difficult for teams to share and analyze data. All the other important details are already mentioned in the list of most important metrics to track further in this article.
IG Insights tools are free, but it’s required to have a business or a creator account to access them. If you turn a personal account into a business option, you can learn valuable information about the content that will be published after such a transition. If you go back to your personal account, all data will be lost.
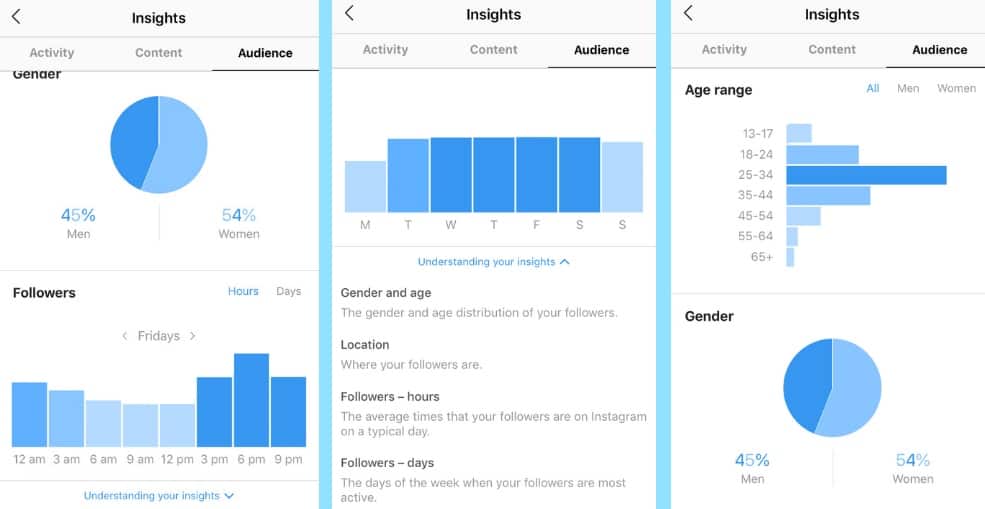
The following Instagram insights are available for professional accounts:
- Recent Highlights: This section announces any notable increases in account performance in your selected preset or custom timeframe within the past 90 days.
- Overview: This section displays the number of reached, engaged accounts, total followers, and approximate profits (if applicable) for your preset or custom timeframe within the last 90 days. Aggregated demographic statistics is obtained thanks to a variety of factors, including information provided by users on their Facebook and Instagram profiles. You can get a more complete analysis of each of these indicators by tapping on them.
- Accounts Reached or Accounts Engaged: AR – refers to the number of unique users who have seen your content — posts, stories, business reels, videos, Live videos, and promoted ads — at least once. AE – refers to the number of users whom 1) you’ve reached 2) interacted with your content somehow (interactions include likes, saves, comments, shares, and replies). Also, you’ll see demographic information on the accounts you’ve reached or engaged in, including top countries, top cities, top age ranges, and gender breakdown. Note that these metrics are estimated and in development.
- Total Followers: refers to the number of people who follow you. What’s nice is that these insights include growth (how many followers you’ve gained or lost), top locations of your followers, age range, and times they’re most active on Instagram. So, you can learn more about trends across your followers when you have at least 100 followers.
- Content You Shared: This section gives you the overall number of posts, Stories, reels, videos, Live videos, and promotions that you’ve shared for your selected preset or custom timeframe within the past 90 days. If you want to see all the posts, Stories, videos, reels, and Live videos on your account, you need to tap under each content type to go to the media library. There, you will view and filter all your content by media type, reach, interactions, and time frame.
You can also tap View Insights under individual posts, videos, and reels, or swipe up on your stories and IG Live videos, to view insights specific to that piece of content which includes:
- Accounts engaged: The engaged audience section shows you how many unique users have liked, commented, saved, shared, or replied to your content. Your engaged audience will be broken down by follower status, gender, age, countries and cities. Note that this metric is only available for posts, stories and IG Live videos.
- Content Interactions: The content interactions section shows you the total number of times people have liked, commented, saved, shared, or replied to your content. It then breaks down this number on a per-post basis. You’ll also see your top-performing posts per category.
- Ad: This section will provide more information on your post if it’s been boosted.
In the Instagram app, you’ll find a summary page and tappable metrics that take you to additional panels with more information. You may access definitions for each measure displayed on each of these screens by tapping the (i) in the top right corner. Use the drop-down menu at the top of the screen if you need to choose a preset or custom period for seeing insights, which must be within the last 90 days.
If you are running a business on Instagram but would like to improve your reels content, here are TOP 45+ Instagram Post Ideas for businesses to increase brand awareness, boost revenue, and promote exposure on the platform.
2. Flick Instagram Analytics Tools
Pricing: custom, all come with a 7-day free trial.
Flick is an all-in-one Instagram Scheduling, Hashtag & Analytics Tool that helps you to grow and manage your Instagram account. It utilizes the official Instagram API for publishing, analytics, and hashtags to help its customers uncover the best hashtags to use on their posts and highlight key hashtag metrics. Flick also enables users to store hashtags in an easy-to-use manner and provides insights into which hashtags they should use or avoid.
The Flick technology is used to search current trends 99% faster than traditional manual research which makes this tool extremely time-saving. It is designed to analyze the content and update you about its performance. This tool has the option to monitor and keep up with the hottest trends, and analyze an account’s activity to dominate the chosen niche by checking the engagement and virality.
This’s a paid Instagram analytics tool, but you are offered to start with a free trial to test the software and get your own successful experience.
3. Creator Studio Free IG Tools
Pricing: free.
This is our third native tool for Instagram business analytics. Again, Creator Studio runs on your computer rather than being integrated into the mobile Instagram app if that matters to you.
Most of the same analytics that are available in Instagram Insights are also available in Creator Studio, although only for a seven-day period. The Calendar view in Creator Studio’s analytics tool lets you quickly and easily check when you last uploaded something on Instagram.
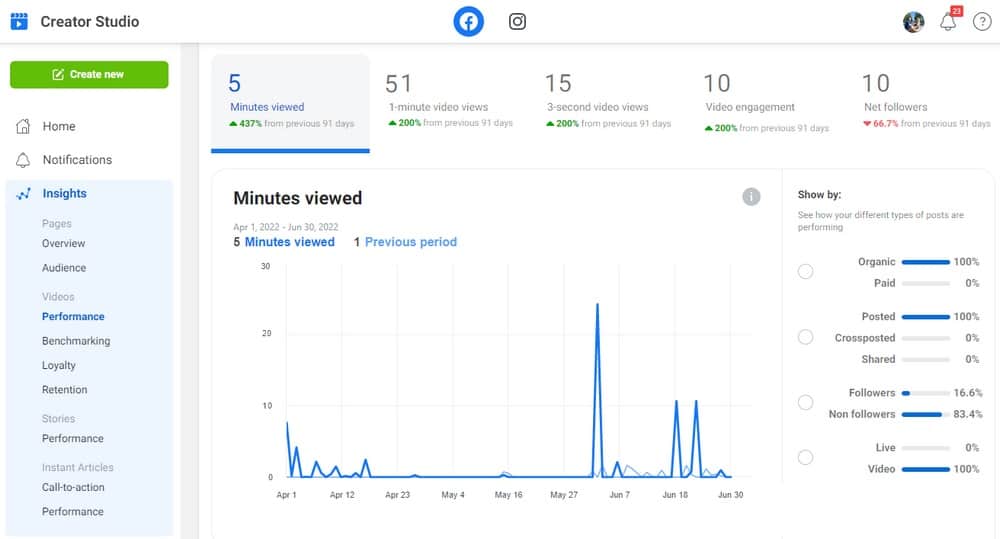
Plus, you can monitor your brand cooperation metrics in Creator Studio if you’re a member of Brand Collabs Manager.
4. Hootsuite Instagram Analytics Tools
Pricing: custom + free for 30 days.
It’s an expensive all-in-one solution, but it’s feature-packed if you can afford the pricer top-tier plans. Hootsuite provides analytics on Facebook, Instagram, Twitter, and Linkedin so you can track your trends in a simple, easy-to-use snapshot. You can view key engagement data such as likes, followers, post views, inbox sentiment, over a set date range.
You can build unlimited custom reports and share your reports with one click to PowerPoint, PDF, Excel, and CSV formats, although the last two require upgrading to a top-tier plan. Also, as the reports will show you which posts or images resonate most with your audience, you can understand the optimal time of day for posting. You can also use the data for the all-important conversion data per result metrics and conversion trackers.
5. Iconosquare IG Tools
Pricing: custom, free for 14 days.
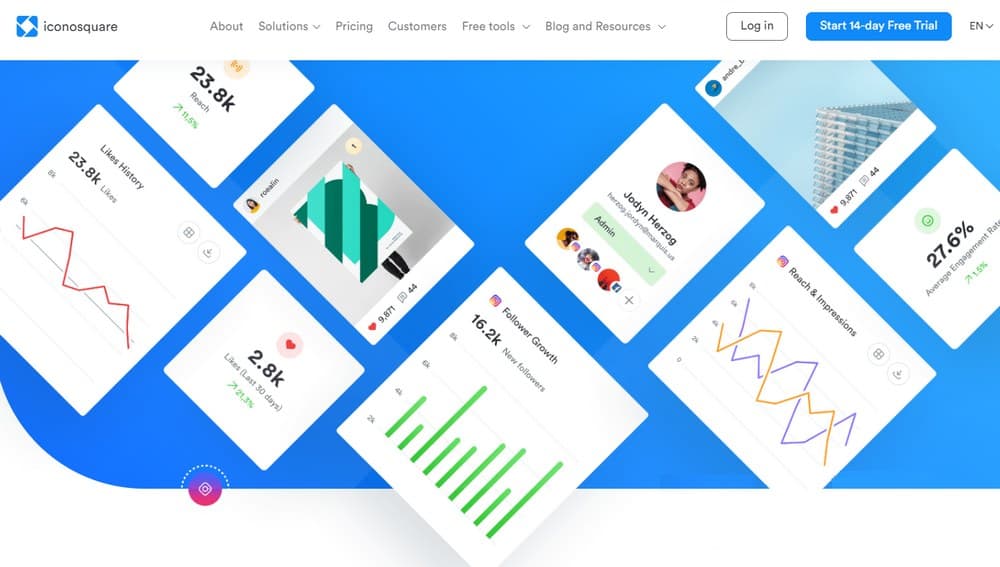
This free Instagram analytics tool gives information about your audience, engagement, likes, saves, and other metrics. Additionally, it shows how your Instagram analytics compare to the platform’s typical rates. It helps to understand how posting frequency affects followers.
The pro dashboard of Iconosquare is available for 14 days for free. A great tool for freelancers or agencies that want to save time when managing multiple accounts/clients from the same dashboard. You’ll receive all the common information, like engagement rates, follower statistics, data for Stories, etc.
Looking for some examples of outstanding Instagram shops to learn from? Here are the Best Instagram Shops to Get Inspiration.
6. Keyhole Instagram Analytics Tools
Pricing: custom + Free for 7 days.
Keyhole analyzes the performance of the industry and campaign-specific hashtags on Twitter and Instagram in real time. This enables brands to promote during peak times while also learning which tags are most popular among their followers.
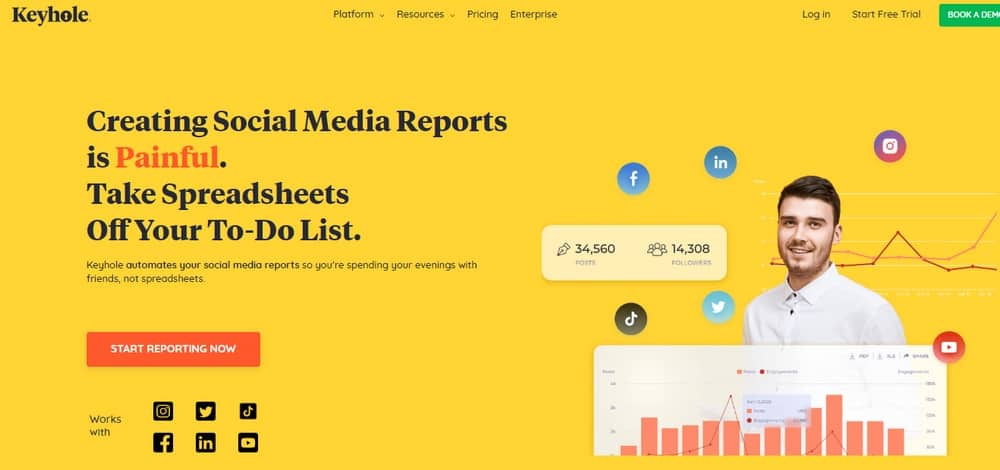
Additionally, choosing a few predefined KPIs to monitor can save you time. In an effortless-to-read dashboard that you can share with team members, Keyhole will automatically report on them.
7. Phlanx Instagram Analytics Tools
Pricing: custom + free for 30 days.
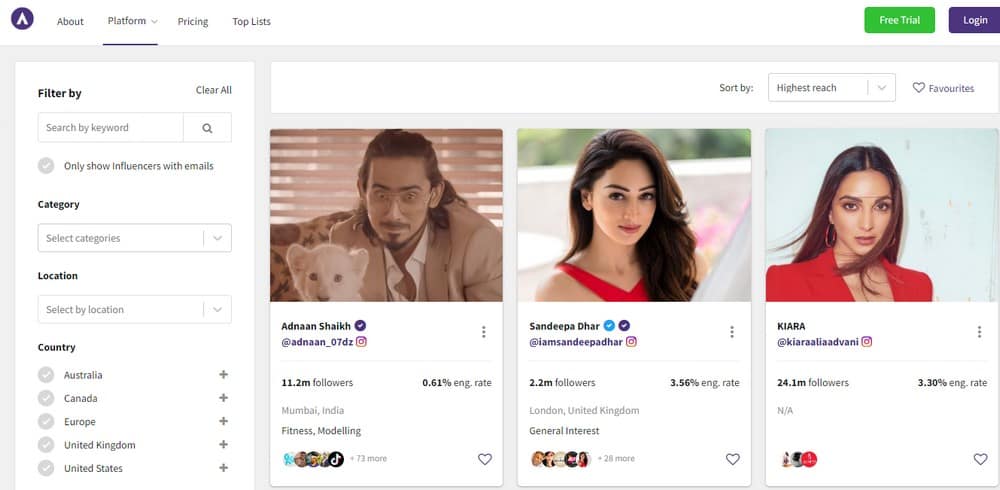
An accessible, free Instagram engagement calculator is provided by Phlanx. This a convenient ig tool because you may use it to check your own or someone else’s account. That means that you may use it to pre-screen potential brand ambassadors and influencers.
You may check the number of followers, engagement rate, and average likes and comments per post by typing in any Instagram account’s name in a search window. Instagram tools like Phlanx are invaluable for spotting accounts with fake followers or determining whether an influencer’s posts are receiving legitimate engagement.
Pricing: free, limited benefits.
This tool for Instagram analytics gives you deep audience insights and identifies follower patterns for you to tailor your content for your audience. That means it will provide details like the most popular words used in your followers’ bios and posts. You can even see the most popular emoji among your target market.
You can also compare how influential your account is compared to others.
9. Analisa Free IG Tools
Pricing: free Basic plan, limited benefits.
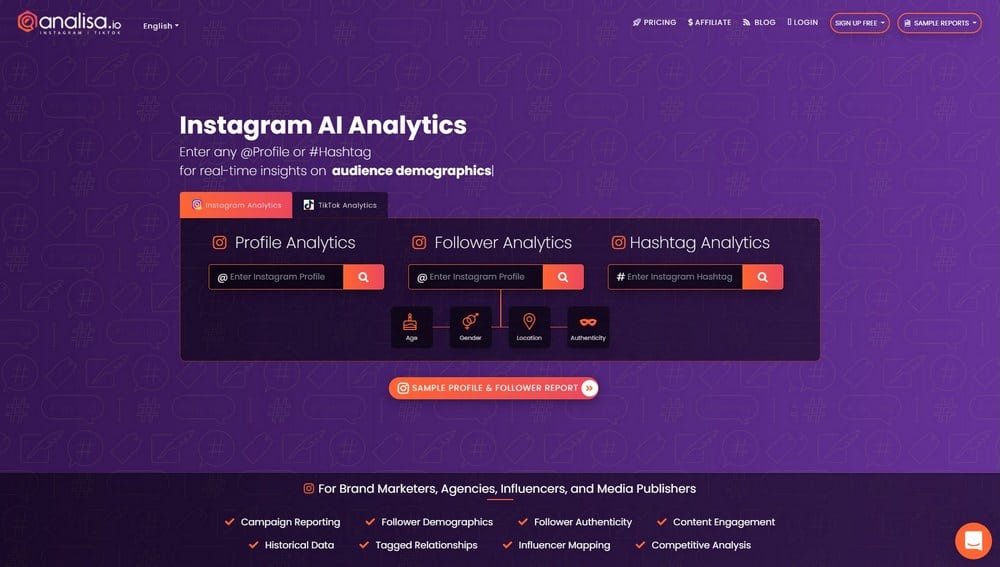
Analisa provides free Instagram analytics data with access to a larger variety of information if you have their paid plan. This Instagram and TikTok social media analytics tool with AI capabilities may examine any public profile or hashtag. They provide in-depth research of followers, hashtags, and public Instagram accounts.
Their insights are detailed and comprehensive for important marketing purposes such as Instagram influencer searches. To assist you to select the influencers with the highest Return on Investment, they, for instance, enabled you to assess the authenticity of Instagram followers by providing a glimpse of their activity levels. Their data is also displayed in plainly visible graphs so you can rapidly learn details like the ideal Instagram posting time while also being detailed enough for presentation purposes.
Pricing: custom + FREE for 30 days
Social Blade is our next Instagram tool that compiles data from YouTube, Twitter, Twitch, Daily Motion, Mixer, and Instagram and uses the data to make statistical graphs and charts that track progress and growth. They include information such as estimated earnings and future projections, providing both numerical data and easy-to-read graphs.
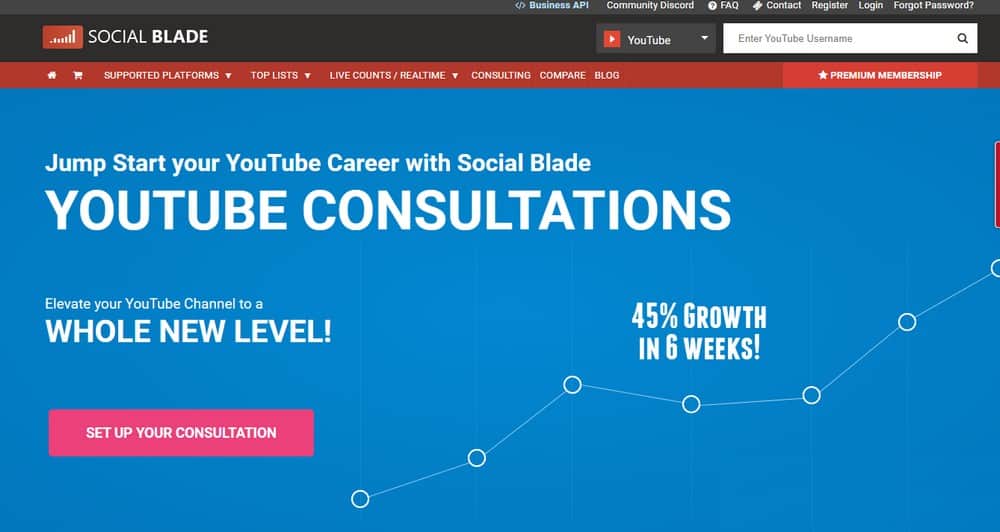
Statistics are freely available to anyone using Their website or smartphone apps. This tool currently tracks over 2.7 million YouTube channels and 352,000 Twitch channels. Social Blade has over 630,000 unique visitors every month.
11. Not Just Analytics IG Tools
Pricing: custom + free benefits.
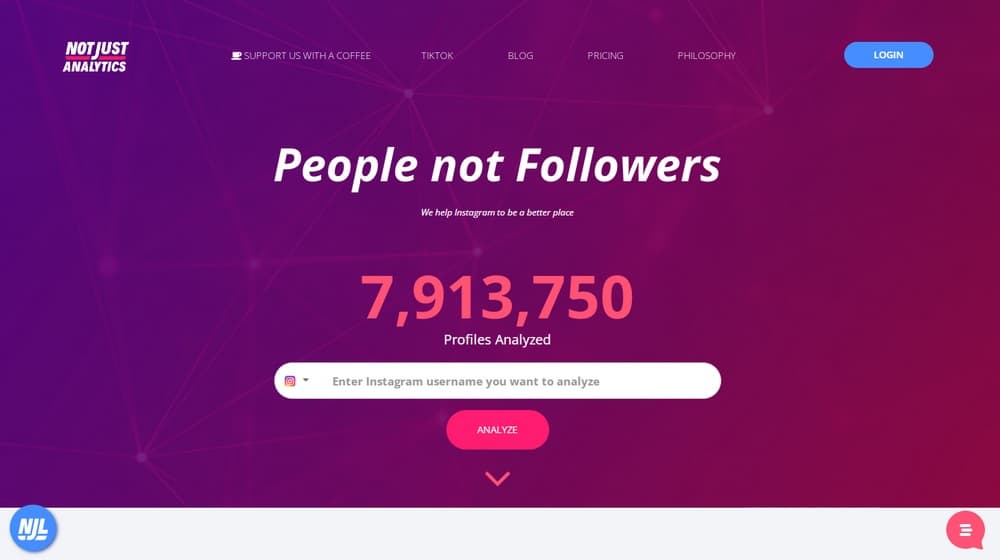
Not Just Analytics is an Italian startup founded in 2018. It was designed to provide a simple and reliable tool for the structured and complete analysis of Instagram profiles. In fact, with Not Just Analytics you have the possibility to:
- Check your profiles and improve them,
- Create detailed reports,
- Analyze performances,
- Obtain commercial information, and
- Analyze competitors’ accounts.
The Instagram Analytics of this tool are generated through the Instagram Graph, which ensures that the accounts examined and the data obtained are official and always managed safely.
It has recently also been adapted to TikTok too, offering the same monitoring and analytics services already in use for Instagram. All Not Just Analytics features can be used directly on the website or by downloading the application.
Pricing: free plan + custom.
With the help of Socialbakers’ free Instagram analytics tool, you can analyze your performance and figure out what kinds of posts your followers like the most by getting statistics on your top posts. You must subscribe to Socialbakers’ AI-powered marketing package if you want to see more advanced data, such as Instagram Story insights.
By utilizing predictive analytics to decide which stories and posts to promote when to post them, and which follower groups to prioritize, the AI suite allows you to manage your Instagram account more intelligently.
13. FB Ads Manager IG Tools
Pricing: custom + free for 14 days.
Facebook Ads Manager is a crucial Instagram tool in your analytics toolkit if you are managing sponsored ads on Instagram. It offers performance and cost data for any advertisement you run across the whole family of Facebook platforms, including Instagram.
Instagram Insights offers performance data for your Instagram campaigns, but if you want to conduct a full cost analysis, you should also include Ads Manager.
Pricing: custom, free for 30 days.
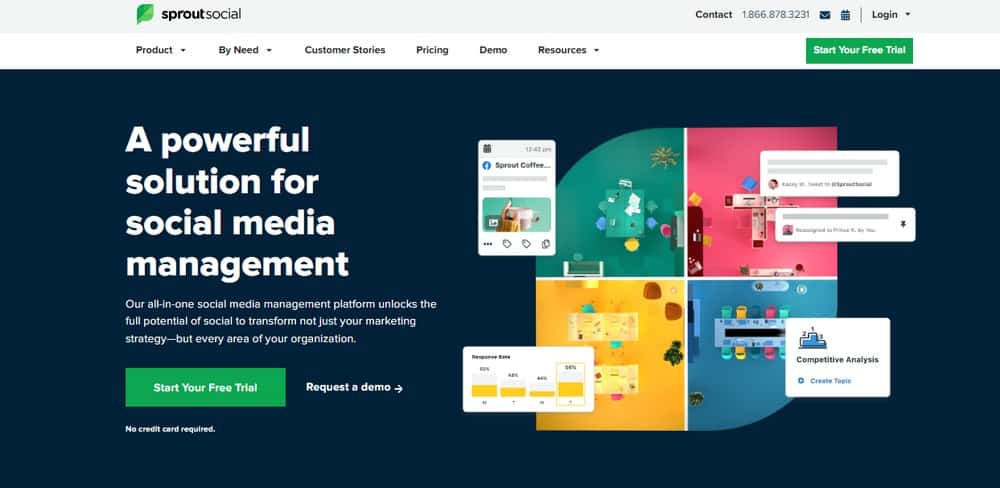
Monitor Facebook Page impressions, Twitter link clicks, Instagram follower growth, LinkedIn engagement, Pinterest content performance, and some other things from a single dashboard. Thus, it is a great ig tool for brands that need an all-in-one project management, Instagram publishing, and analytics tool.
Sprout includes both template and customizable reporting options, giving you a variety of options for not only gathering essential social metrics but also truly understanding what they mean and presenting them to others, allowing you to focus on the metrics that are most important to you.
15. Later Instagram Analytics Tools
Pricing: Free + custom.
The last in the list Instagram analytics application called Later may assist you to expand your company by improving your IG marketing strategy. This social media platform stands out because of its Linkin-bio function, which lets you link your Instagram posts to particular URLs, such as product pages. From your Instagram profile, you can then monitor website clicks, page views, and click-through rates in addition to seeing how many purchases a certain post led to.
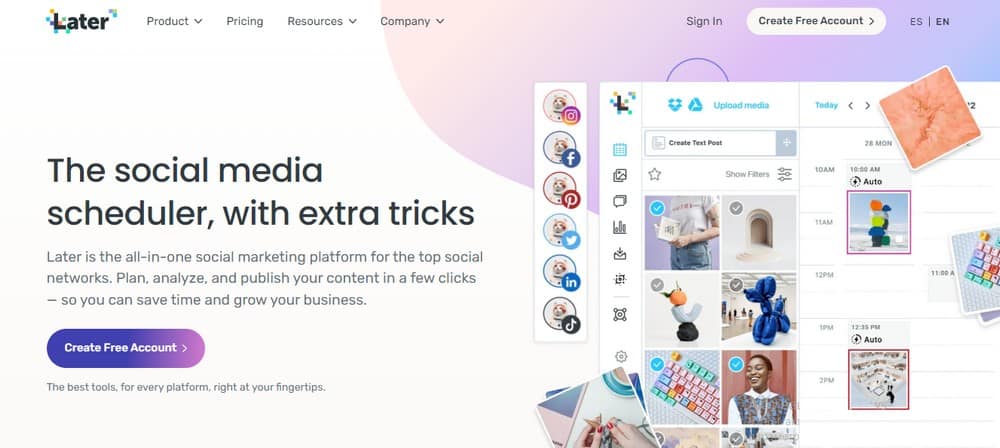
Even while Later has a free plan for people, you may use its premium packages to have access to a variety of essential IG data, including Instagram Story insights.
As you can see there are plenty of analytics tools and apps out there to track your analytics on an even deeper level and with even more insight, but it’s all about your budget and choice to invest in those tools. Now that you know Instagram metrics to track, the choice of your Instagram analytics tool should be easier.
Instagram shopping has become increasingly popular nowadays. If you don’t know about it yet, check out our What is Instagram Shopping? and How to Add and Set Instagram Shop guides.
7 Important Instagram metrics to track with IG Tools
What are Instagram metrics you should track to reach the goals that matter to you?
Nowadays, social media marketing is an integral part of a digital marketing plan. Tracking the most important Instagram metrics is crucial to growing your or your clients’ accounts and building an engaged following.
IG analytics is a native analytics tool that reports demographic and subscriber activity data, plus content data. You can view insights for specific posts, Stories, videos, business reels, and Live videos you’ve created to see how each one performed and how people engaged with them.
This information makes it easy to compare content, analyze the performance of individual posts in order to see what is working and what isn’t, and calculate campaign metrics to adjust the social media strategy accordingly.
Whether you are evaluating an influencer client’s Instagram account or tracking your own Instagram business profile, below are the most important metrics to measure the success of an account and better inform the type of posted content. Here are seven essential Instagram metrics that you should track to measure your performance:
1. Follower Growth Rate
A follower growth rate helps you to determine whether or not your company is growing and attracting new customers. Although having a large number of followers might raise your company’s reputation, it still doesn’t mean your marketing campaigns and Instagram strategy are succeeding. Followers count might change for a variety of reasons, that’s why generally it’s more valuable to have a smaller but more engaged audience because an engaged audience is more likely to promote your business, buy your goods, give honest feedback and share your content with the rest of the world adding their opinion.
Looking at these metrics you should pay attention to the percentage, not to the number itself:
Monthly Growth Rate = (Followers on the last day of the month – (minus) Followers on the first day of the month) divided by Followers on the first day of the month and multiplied by 100 (in order to get a percentage).
An example: let’s say your Instagram account had 759 followers on July 1 and 825 followers on July 31. The Growth Rate for the month of July would be calculated as:
825 minus 759 = 66
66 divided by 759 = 0.08695
0.08695 multiplied by 100 = 8.7%
That % would be important in determining your Instagram performance.
2. Engagement Per Follower
Your Instagram engagement rate is a key indicator of how well your audience is responding to your content (comment, leave likes, save posts and share your content).
Nowadays, engagement is more important than ever to ensure your posts are seen because Instagram changes its algorithm quite often. You can calculate your engagement metrics on a monthly or weekly basis.
Again will leave short guidance on how to calculate your engagement rate:
Divide your total number of likes and comments by your follower count, and then multiply by 100 to give you a percentage.
Here is an example:
You have gotten 133 likes and comments during the week and you had 825 followers. The engagement per follower rate for that week would be calculated as:
133 divided by 825 = 0.16121
0.16121 multiplied by 100 = 16%
When it comes to video content, engagement rates might be misleading because people more often watch it rather than leave “like”. For a more accurate benchmark, use metrics like reach or comments.
3. Website Traffic
In IG you can’t add clickable links to each post (only it’s allowed to add a link in bio) unless your brand’s over 10k followers – in this case, you can add swipe-up links to your stories. “Instagram Swipe” is an incredibly powerful tool with limitless potential and many brands have already been enjoying some incredible results. You can use the CTA inside Instagram Stories to:
- Run a promotion for goods or services you offer
- Show “behind the scenes” of your business and include a link to your website page to see more
- Promote an online course through a series of slides and include a CTA to the landing page in the last one
- Share exciting and useful new content
- Tease a new product and include a link to its landing page
- Run a sale
There are countless options! Try a couple, and then use your analytics program to monitor Instagram traffic to your website.
Google Analytics, which divides your traffic into default channel categories, one of which is “social,” may be used to measure the number of website visits coming from Instagram.
In your Google Analytics account, go to “Acquisition”, then “Channels” and choose “Social” to discover precisely which social media sites are bringing visitors to your website.

4. Instagram Reels Engagement
Have you ever thought about how a business can use Instagram reels content as a marketing strategy? Reels are a powerful tool for expanding your audience beyond your present list of followers. The explore page is where 50% of Instagram users discover reels. To reach a completely new audience, you may include your videos on the explore page.
According to recent statistics done by Conviva Instagram Reels has gotten NBA franchises 22% higher engagement than the average engagements they’ve had from standard Instagram posts or Instagram Stories. This is encouraging not only for the franchise but also for other successful big businesses, such as influencers, content creators, artists, musicians, and a plethora of other people seeking a way to engage with their target audience on Instagram.
While Instagram Reels analytics are a fairly new addition to the Insights tab, you can still view important metrics such as Comments, Likes, Saves, Reach, Plays, and Interactions. With a help of Reels analytics you can:
- Compare individual reels based on their performance, including all posts in the last 2 years.
- Check the reach and engagement rate of individual reels.
- Compare the performance of reels to other content formats on Instagram.
How to measure your Instagram Reels engagement rate:
Reels Engagement Rate = Divide the number of Reels interactions by Reels Plays, and then multiply it by 100 to give you a percentage.
Note that Reel interactions indicate the number of unique users who have viewed your Reel and Plays is the number of times your Reel was played in total.
Here is the math in action:
Your Reel has gotten 978 interactions and 2357 plays. Reels engagement rate would be calculated as:
978 divided by 2357 = 0.41493
0.41493 multiplied by 100 = 41.49%
Do you see? Now you may better understand how your Reels are performing relatively to one another by using the Plays number to measure your engagement rate.
Take advantage of these 26 Instagram Reels Ideas For Business And Online Stores.
5. Comments Per Post
Comments are more valuable when it comes to engagement. When someone leaves a comment, it shows that you’ve really caught their interest and connected with them in some way.
However, the quantity of comments you receive is one of the crucial metrics to monitor. Keep an eye on your average # or % and note if it increases or decreases. Find out why your audience is less involved than it once was if your average number of comments has decreased.
To observe if a trend develops over time, it’s also a good idea to keep track of which of your particular posts receive the most comments. Use Flick if you don’t have time to check all your posts manually every day or week. This tool is developed not only to search and discover viral content which you can recreate or reuse in your own blog but also helps to monitor how well your posts are performing and what’s its engagement rate. Create additional articles like that which are shown viral, for instance, if your audience likes a certain kind of product, its photo or topic to discuss, keep maintaining a high level of interaction thanks to it.
6. Instagram Stories Engagement
Instagram Stories are one of the best ways to build a stronger relationship with your audience — and tracking your view count, taps forward, and taps back will tell you what’s really resonating.
Each individual story slide that’s posted to Instagram will have its own metrics — including replies, impressions and navigations. It will help you to know what holds your audience’s attention and what they rush to skip.
Here are two popular ways to measure your success on stories:
- When you have more than one story slide, you calculate watch through rate or completion rate:
Watch through rate = Final story number of views divided by the First story number of views and multiply that number by 100 (to get the percentage).
Example #1:
You have 5.521K followers, the first slide was seen by 2.112K people, and the last one by 1.618K.
1.618K divided by 2.112K = 0.76609
0.76609 multiplied by 100 = 76.6%
This stat tells you how good your posts are at grabbing and retaining attention. It’s natural to see a bit of drop off after the first one and every business is going to have a slightly different ideal completion average.
- When you have 1 slide and want to know a view rate:
View rate = Take the number of people who viewed your story, divide it by the total number of followers you’ve got, and multiply that number by 100.
Example #2:
You have 5.521K followers and 1.341K people have seen your story.
1.341K divided by 5.521K = 0.24289
0.24289 multiplied by 100 = 24.3%
You can use it to compare individual stories and determine what type of Instagram content does best with your followers.
You are selling a course, for example, you need the information from your stories to be shown to as many people as possible, so you can ask your followers in stories not to skip the following number of stories (let it be 10 slides) explaining that thus Instagram will define this information as important and valuable and will show to a more targeted audience.
7. Reach
Reach shows how many unique accounts have seen your post, and therefore how much awareness and value you’re gaining. So, if your target is to increase the brand’s awareness and gain the highest number of users, you should focus on growing your reach on Instagram. If a post receives higher (or lower) reach than usual, you can use those results as insight for future posts and stories.
In case you want to get all the juice from Instagram analytics which you can track using your phone below, you’ll find the best level of insights to make sure you are keeping things right, measure your success properly, and make sure that you know what to look out for as you are growing your IG audience. It’s time to dive into it now, let’s go!
Conclusion
Social media accounts, just like any other business, gain value from their user base. It is the number of followers, average engagement per post, and the sentiment in the comments of your followers that defines your potential earnings from the monetization of your account.
The engagement levels that your content generates indicate to the Instagram algorithm the potential “demand” level for the content.
If you manage to generate high demand potential (by people engaging with your content) and your content meets low competition, you have the potential to gain high organic exposure, brand awareness, and a loyal customer and follower base.
Here are some recommended articles about social commerce that might be useful:
- What is Social Commerce and Why You Should Try It
- Social Commerce Tips to Earn Money with Social Media
- 10 Best Social Commerce Platforms to Open Online Shop
- What is Instagram Shopping? Learn how to earn with Social Commerce
- How to Add and Set Instagram Shop
- Best Instagram Shops to Get Inspired
- TOP 45+ Instagram Post Ideas For Business
- Top Instagram Reels Hashtags
- 26 Instagram Reels Ideas For Business And Online Stores
We hope you will find your best Instagram analytics tool in this list and grow on IG faster;)

